
AI visualisation tools are transforming how businesses in the UK handle data. Unlike dashboards that rely on static, past data, AI solutions predict trends, provide actionable insights, and simplify complex processes. Here's why they matter:
Quick Overview:
Which is better for your business? If you're spending too much time on manual data tasks or need faster, smarter insights, AI could be the answer. Read on to learn how AI tools work, their benefits, and practical tips for SMEs.
Traditional dashboards display data visually - using charts, graphs, and KPIs - to provide a quick overview of operational metrics like sales, traffic, or inventory. However, these tools are inherently backward-looking. They focus on historical data, leaving gaps in understanding what’s happening now or predicting what might happen next.
The data presented in traditional dashboards is static, offering snapshots from the past. For example, you might review last week’s sales figures or last month’s customer acquisition stats, but by the time you see it, the information is already outdated. This delay means decisions are often based on what has already happened rather than what is currently unfolding. As bValue Venture aptly points out, "Businesses are busy reporting the past… while competitors are acting on the present".
The underlying architecture of these dashboards is built for batch processing rather than real-time analysis. Data is extracted, transformed, and loaded (ETL) into a centralised warehouse, typically updated on weekly or monthly cycles. This process introduces significant delays, making it harder to act quickly. These delays also complicate manual analysis, which is already time-consuming.
Traditional dashboards’ reliance on static, historical data creates a heavy burden when it comes to extracting actionable insights. Building even a single dashboard can take hours, requiring users to select relevant metrics, determine the right visualisations, organise layouts, and ensure everything is comprehensible. Whether it’s wrestling with Excel’s limitations or navigating the complexities of business intelligence (BI) tools, SMEs often find the process laborious and inefficient.
Another major issue is the dependency on technical expertise. Customising reports or views typically requires SQL skills, leaving non-technical staff reliant on IT teams to access data. This creates the dreaded "IT queue", where marketing and sales teams must wait for their data needs to be met. SMEs can lose between 50 and 100 hours each month to manual reporting tasks - time that could be better spent on strategic initiatives.
Perhaps the most frustrating limitation is the lack of context. While traditional dashboards excel at presenting the "what" - raw figures and trends - they often fail to explain the "why" behind anomalies or shifts. This can lead to conflicting interpretations across teams, especially when departments use different definitions for the same metrics. This "which number is right?" dilemma highlights the need for tools that provide real-time, predictive insights, setting the stage for AI-driven visualisation.
AI-driven visualisation is changing the way SMEs interact with their data by connecting directly to live data streams. Instead of relying on outdated snapshots, these systems ensure dashboards reflect the current state of operations. In practical terms, this means your data is always up-to-date - no more waiting for scheduled updates or manually refreshing spreadsheets. The system pulls in information from tools like CRMs, accounting software, and e-commerce platforms, keeping everything in sync automatically.
But it doesn’t stop at just displaying numbers. AI takes on the heavy lifting of data preparation. It cleans up messy datasets, removes duplicates, and performs SQL transformations without human intervention. This automation can cut data cleaning time by as much as 70%. Businesses using AI-driven workflows have also reported operational costs dropping by 44%.
One standout feature is Natural Language Processing (NLP). With NLP, even non-technical staff can create visualisations by simply asking questions in plain English. For example, a sales manager could ask, "Which region had the fastest profit growth this quarter?" and instantly receive a clear, accurate answer. This ease of access has dramatically increased dashboard usage, with 75%–80% of employees in some companies now relying on these tools. It’s a big shift compared to traditional systems, where only a few technical users could extract insights. By simplifying access and making data more usable, AI is paving the way for real-time insights and predictive analytics.
Traditional dashboards often show only historical data, but AI systems go a step further - they uncover and explain trends as they happen. By processing thousands of data points simultaneously, these tools can quickly identify anomalies. If a metric suddenly spikes or drops, the system doesn’t just flag it; it also digs into the cause and provides a narrative explanation. This turns raw numbers into actionable insights, enabling businesses to react in hours instead of weeks.
"AI/BI Dashboards have been an incredibly transformative product... The use of Dashboards for internal reporting has increased overall organisational transparency and enabled non-data teams to make data-informed decisions".
Philip Basaric, Product Manager for Data Products at Whip Media, highlights how this shift from reactive reporting to proactive monitoring allows SMEs to tackle problems - like unexpected churn or inventory shortages - before they spiral into bigger issues.
Modern AI tools also address concerns about transparency. They provide inspectable SQL or Python code for every visualisation, ensuring data teams can audit the logic behind the insights. At the same time, security is prioritised with encrypted, read-only connections and SOC 2 Type II compliance. This combination of real-time monitoring and transparency builds trust while enhancing decision-making.
AI’s capabilities don’t end with real-time insights. It also helps businesses look ahead with predictive analytics.
AI-driven visualisation doesn’t just analyse what’s happening now - it predicts what’s likely to happen next. By examining historical data, user behaviour, and purchasing trends, machine learning models can forecast outcomes with up to 95% accuracy. This transforms dashboards from being purely retrospective to becoming tools for forward planning, answering the question: "What should we do next?"
Scenario modelling adds another layer of value. SMEs can simulate potential outcomes before making decisions. For instance, a business considering a 20% increase in advertising spend can instantly see the projected impact based on existing data patterns. These "what-if" analyses remove much of the guesswork, helping companies make more confident, data-backed decisions.
Organisations using AI report a 25% reduction in the time it takes to gather insights. Furthermore, leadership decisions are made 15%–30% faster thanks to AI-enhanced tools. Automated alerts also play a crucial role, notifying managers when metrics deviate from expected ranges or when forecasts signal potential issues. Instead of discovering a profit dip weeks later, managers receive early warnings, giving them time to adjust strategies - whether that means tweaking pricing, reallocating inventory, or shifting marketing efforts.
"AI is no longer a nice-to-have; it's a prerequisite for data-informed decision-making".
As Ruby Williams points out, this predictive power equips businesses to respond to market changes more effectively and with greater speed.
Traditional Dashboards vs AI-Driven Visualisation: Key Differences Comparison
When deciding between traditional dashboards and AI-driven visualisation, small and medium-sized enterprises (SMEs) need to consider factors like decision speed, ease of use, cost, and technical demands.
Speed and accessibility highlight the biggest difference. Traditional dashboards often require specialised technical skills for setup and maintenance. Need a new report? You might be waiting weeks - or even months - for a specialist to deliver it. On the other hand, AI-driven tools allow non-technical users to ask questions in plain English and get answers within minutes. As Sheary Tan from Livedocs explains:
"Traditional BI tools answer the questions you ask them. AI data analysis figures out what questions you should be asking".
Cost structure is another area where these approaches diverge. Traditional systems come with hefty licensing fees and the added expense of hiring specialists or AI consultants. AI-driven platforms may require a higher initial investment, but the ongoing maintenance costs are much lower. When calculating the total cost of ownership, it’s important to include factors like training, support, and salaries for analysts - not just the software itself.
Technical requirements further set the two apart. Traditional tools demand knowledge of SQL, DAX, or complex interfaces. In contrast, AI platforms empower any team member to generate insights without needing to code. The table below captures these key differences.
| Feature | Traditional Dashboards | AI-Driven Visualisation |
|---|---|---|
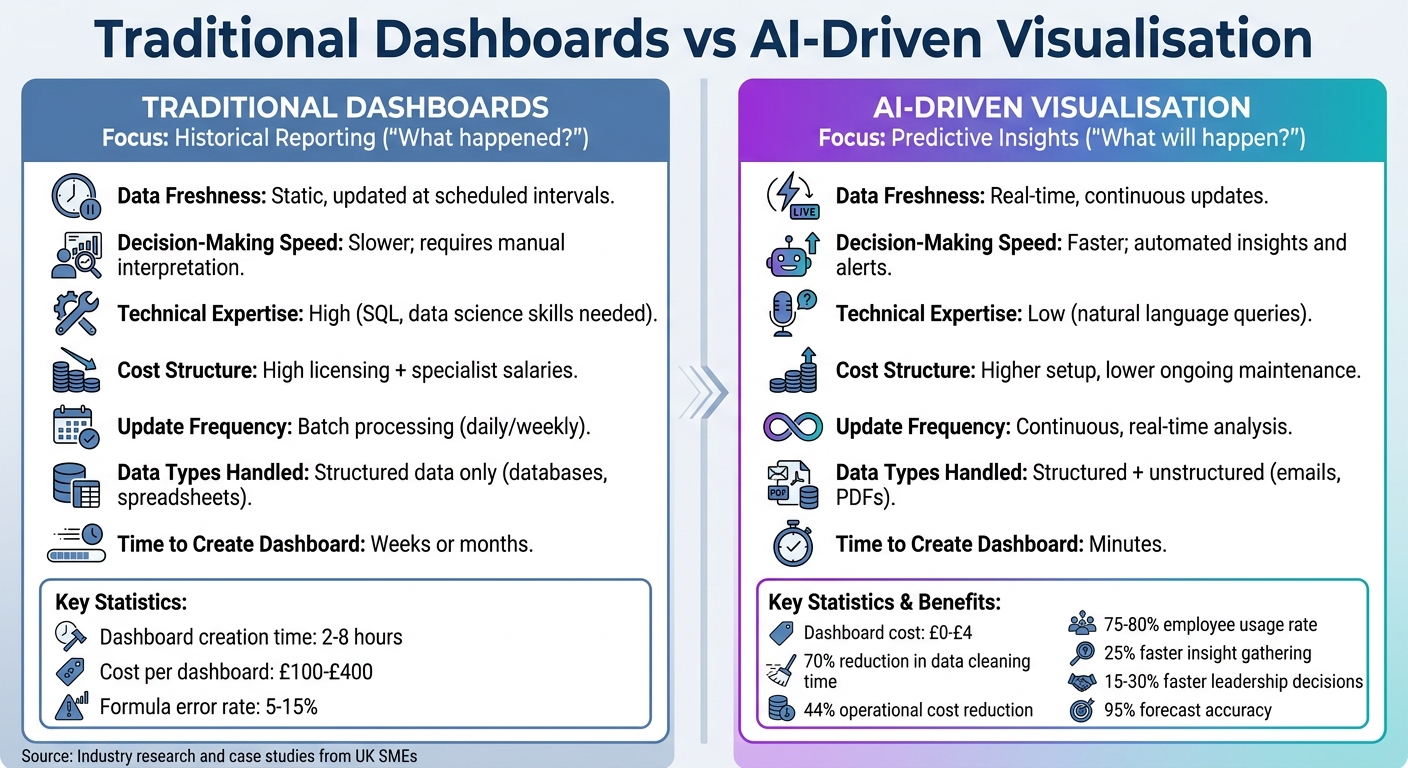
| Data Freshness | Static, updated at scheduled intervals | Real-time, continuous updates |
| Decision-Making Speed | Slower; requires manual interpretation | Faster; automated insights and alerts |
| Technical Expertise | High (SQL, data science skills needed) | Low (natural language queries) |
| Cost Structure | High licensing + specialist salaries | Higher setup, lower ongoing maintenance |
| Update Frequency | Batch processing (daily/weekly) | Continuous, real-time analysis |
| Data Types Handled | Structured data only (databases, spreadsheets) | Structured + unstructured (emails, PDFs) |
| Time to Create Dashboard | Weeks or months | Minutes |
| Primary Focus | Historical reporting ("What happened?") | Predictive insights ("What will happen?") |
For small and medium-sized enterprises (SMEs), the promise of AI-driven visualisation tools is clear, but making it work requires careful consideration of costs and how well these tools integrate into existing operations, often starting with AI feasibility studies. Getting these factors right can mean the difference between a smart investment and an unnecessary expense.
AI-driven visualisation tools bring more than just better decision-making - they can significantly cut costs. While traditional dashboards might seem like a cheaper option at first, the hidden costs quickly add up. For example, creating a single manual dashboard can take anywhere from 2 to 8 hours of an analyst's time. With hourly rates averaging £50, that’s a cost of £100 to £400 per dashboard, and that’s before factoring in the time and expense of updates.
On the other hand, AI-powered tools usually operate on a subscription basis, costing between £8 and £80 per month. Each dashboard generated by these tools costs as little as £0 to £4. Updates, which take 30–60 minutes for manual dashboards, are nearly instantaneous with AI automation. Plus, manual dashboards built in Excel carry a 5–15% formula error rate, which can undermine the accuracy of your forecasts.
Clearly, the cost savings and error reduction from AI tools can make a compelling case for their adoption. But cost is only one piece of the puzzle.
For many SMEs, the real challenge lies in making new tools work with the systems they already use. Integration issues are a significant hurdle, with 95% of businesses identifying them as the main barrier to AI adoption. If your team relies on platforms like Xero, Shopify, or HubSpot, manually transferring data between these systems wastes time and introduces inefficiencies. AI tools can streamline this process by automatically consolidating data, eliminating the need for costly middleware.
Data silos further complicate matters. According to 81% of IT leaders, these silos actively hinder digital transformation efforts. The real question isn’t whether AI can access your data but whether it can do so without requiring expensive custom development or middleware subscriptions.
Consider the example of a Yorkshire retailer that cut stock-outs by 60% and reduced overstock costs by 35%. By integrating AI tools, they also saved £7,800 annually on middleware fees.
Before investing in any AI system, it’s essential to review how your data flows. If your team relies on manual data transfers or if only one skilled employee can extract useful insights, integration issues are likely a problem. The right AI solution should simplify these processes, not add new complications.
While traditional dashboards shine in providing stability and reliability, AI tools bring dynamic and adaptive insights into the mix. Deciding between these options - or combining them - depends on your business's unique needs. Traditional dashboards work best for tasks like precise audit trails, ensuring compliance with regulations, and delivering stable historical reports. These features make them indispensable for financial oversight and governance. On the other hand, AI-driven visualisation excels in areas like predictive analytics, automated anomaly detection, and simplifying data for non-technical users.
Andrew Chen, Founder of Explo, highlights this balance perfectly:
"AI is an evolution of BI, not a replacement. Business context and ethical considerations still require human judgment that AI models cannot fully replicate".
This perspective is especially relevant for small and medium enterprises (SMEs), which can benefit from combining traditional dashboards with AI tools. For example, dashboards can handle essential monitoring tasks, while AI tools can drive innovation and deeper analysis.
Start by reviewing your current data processes. If your team spends more than half their time on repetitive tasks, consider workflow automation or launching a pilot project in one department. Marketing, for instance, might test AI for churn prediction, while existing dashboards continue to manage company-wide financial reporting. This cautious approach reduces risk and gives you measurable results before committing to a broader rollout.
To integrate AI into your systems effectively, begin with small, focused steps and assess the outcomes. This approach ensures that advanced AI capabilities complement your existing setup without overwhelming your operations.
If you’re unsure where to begin, consider scheduling an AI Strategy Workshop. These workshops can help identify high-impact use cases tailored to your business. For SMEs using platforms like Xero, Shopify, or HubSpot, services like Operational Insights and Reporting can transform siloed data into actionable visualisations.
Clean data is the backbone of accurate and reliable AI visualisation. When data is messy or inconsistent, the insights generated can lead to incorrect conclusions, ultimately rendering the analysis ineffective. By prioritising data quality, businesses can ensure that AI-driven tools deliver results that are both meaningful and actionable, helping to make better decisions and maximise value.
To get started with AI visualisation in your ecommerce SME, consider using no-code AI tools. These tools can process data from various sources like sales figures, website traffic, and customer feedback without the need for complex coding. Focus on analysing key metrics such as sales revenue or product performance, and use AI-powered dashboards to display trends and uncover the underlying causes of any issues.
Start small by working with a manageable dataset. This allows you to fine-tune your dashboards over time, ensuring the insights you gain are practical and directly relevant to your business needs. Over time, you can expand and refine the process for deeper, more tailored insights.
AI insights can indeed be accurate and reliable, but only when they undergo proper validation. This process is crucial to catch any errors or so-called "hallucinations" - instances where AI confidently generates incorrect information. Without thorough checks, it's difficult to ensure the reliability and consistency of these systems.
Our mission is to empower businesses with cutting-edge AI technologies that enhance performance, streamline operations, and drive growth. We believe in the transformative potential of AI and are dedicated to making it accessible to businesses of all sizes, across all industries.